
SporeLag 1.2 Is Now on CRAN. What Changed in Version 1.2?
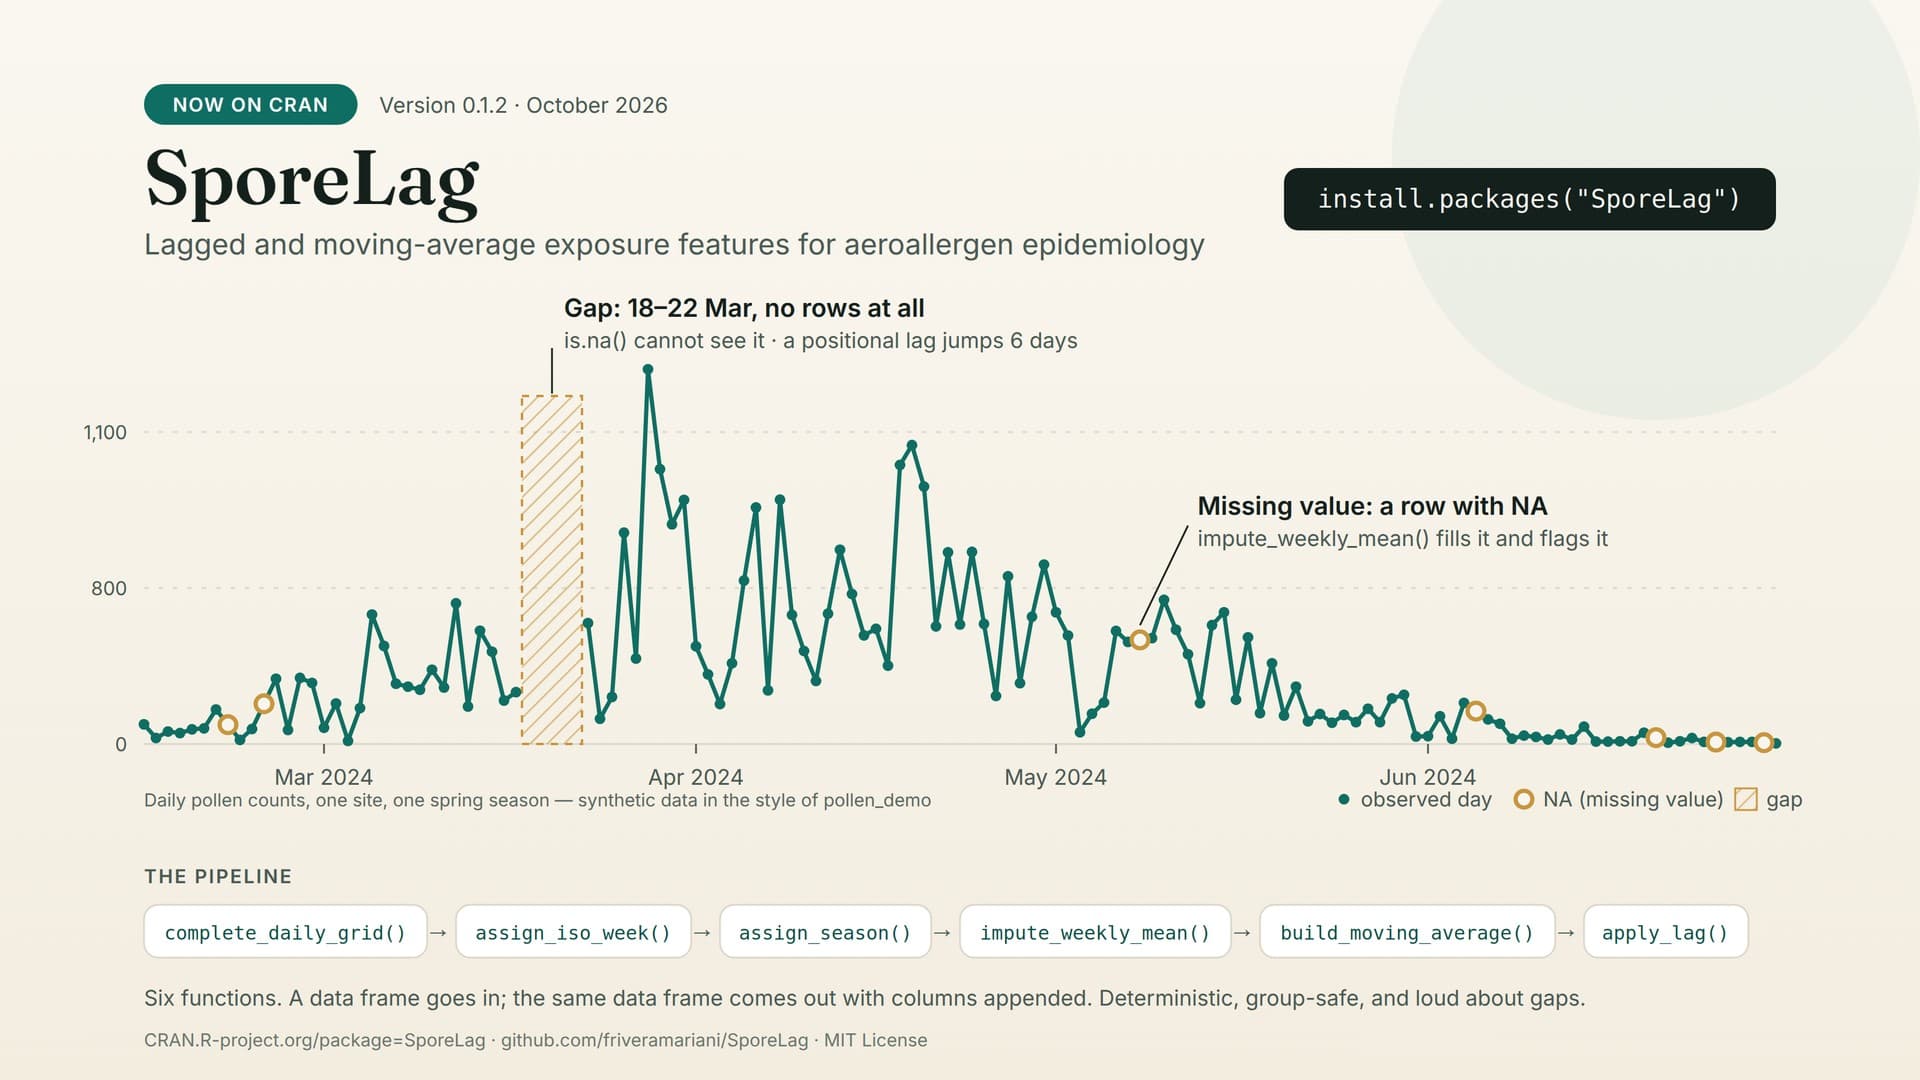
SporeLag is now on CRAN. Version 0.1.2 was published on October 6, 2026, which means any R user can install it with one line:
install.packages("SporeLag")
SporeLag turns daily environmental exposure series—pollen and fungal spore counts, and also ozone, particulate matter, and other time-varying exposures—into analysis-ready lagged and moving-average features for environmental epidemiology and public health research. The version number is small; the milestone is not. CRAN review is what makes a package safe to put in a methods section: it is checked on multiple platforms, archived with a permanent DOI (10.32614/CRAN.package.SporeLag), and installable by anyone without a GitHub account.
What changed from 0.1.1 to 0.1.2
Version 0.1.1 was the first submission to CRAN. The reviewers asked for one thing: a proper vignette, not a placeholder that only loaded the package. Version 0.1.2 is that resubmission. There are no changes to the functions, their arguments, their defaults, or their output—code written against 0.1.1 runs unchanged.
What is new:
- A complete
getting-startedvignette. It walks the whole pipeline on the bundledpollen_demodata set and is now published on CRAN. It covers gaps versus missing values, the classed error you get when a grid has gaps, ISO week and year boundaries, custom seasons, imputation flags andmin_obs, moving-average defaults, and within-group lags. - A README clarification that
stats(part of base R) is imported alongsidecliandrlang. Those three remain the package’s only dependencies, by design. - Updated package metadata and citation files for the 0.1.2 release.
The problem SporeLag solves
Lagged exposure is the workhorse of aeroallergen epidemiology: today’s emergency visits, yesterday’s pollen. The arithmetic is trivial. What is not trivial is the data underneath it.
Daily monitoring series have two kinds of holes, and most code treats them as one. A missing value is a row that exists with an NA in it—is.na() finds it, and any imputation routine can fill it. A gap in time is a day with no row at all. is.na() cannot see it, and a positional lag (dplyr::lag(), data.table::shift()) silently steps over it: the “one-day lag” on the far side of a five-day instrument outage is actually a six-day lag. The analysis runs, the coefficients look plausible, and nothing tells you.
SporeLag refuses to do that. apply_lag() and build_moving_average() check that each group has a complete daily grid and stop with a classed error (sporelag_error_gaps) if it does not. The fix is always the same explicit step, complete_daily_grid(), which inserts the absent days as rows with NA so that the gap becomes a missing value you can see and handle on purpose. Choosing to never auto-fill gaps inside a lag function is documented as a design decision in the package, and the vignette now shows exactly what the error looks like and why.
Six functions, one contract
library(SporeLag)

model_ready <- pollen_demo |>
  complete_daily_grid(date = "date", by = "site") |>
  assign_iso_week(date = "date") |>
  assign_season(date = "date") |>
  impute_weekly_mean(value = "count", by = "site") |>
  build_moving_average(value = "count_imputed", window = c(3, 7),
                       date = "date", by = "site") |>
  apply_lag(value = "count_imputed", lags = 0:3,
            date = "date", by = "site")
Every exported function follows the same rules: a data frame goes in and the same data frame comes out with new columns appended—nothing dropped, reordered, or modified. Operations stay strictly inside by groups, so a site’s lag never borrows a value from another site. Everything is deterministic. And every default is an analytic decision, not a cosmetic one: moving averages are trailing and include the current day, edge windows are left NA unless min_obs says otherwise, imputed values arrive with a companion _imputed_flag column so that sensitivity analyses can exclude them, and ISO weeks are computed internally so that the same input gives the same weeks on every platform.
Who it is for
I wrote SporeLag for the kind of work the RIPLRT Institute does—linking pollen and fungal spore counts to respiratory outcomes in communities that carry a disproportionate share of that burden—and for the students who build those data sets for the first time. The pipeline is short enough to read in a minute and strict enough to catch the mistakes that cost weeks. It also fits anyone working with daily exposure series beyond aeroallergens, including air pollution and heat.
If you try it, the fastest way in is the getting-started vignette. Bugs, feature requests, and ideas are welcome on GitHub. The source is MIT-licensed at github.com/friveramariani/SporeLag, and the package is also archived on Zenodo (10.5281/zenodo.21364422).
My thanks to Dr. Benjamín Bolaños-Rosero, who introduced me to aerobiology and to the data sets that shaped every default in this package.